Agnieszka Golec de Zavala & Oliver Keenan, PrejudiceLab, Goldsmiths, University of London


Agnieszka is head of the PrejudiceLab and Reader in the Psychology department at Goldsmith, University of London. She is a member of the AcademiaNet. The Portal for to Excellent Women Academics (http://www.academia-net.org) and has contributed to several diverse research areas, including psychological predictors of political conservatism, the role of motivated cognition in intergroup conflict, social identity, narcissism and collective narcissisms. Oliver completed his BSc (Hons) in Psychology and MSc in Psychology of Social Relations at Goldsmiths before starting his PhD under the guidance of Dr Golec de Zavala. His research will evaluate the role of collective narcissism in preference for certain forms of political leadership. He maintains wider interests in human well-being, peace and conflict.
There has been a pronounced change in political opinions as the pandemic in Poland unfolded. About 40% of our respondents decided not to vote in the presidential elections should one take place (Figure 1). The presidential election had been planned for May 10th and the presidential campaigns had been ongoing before the outbreak of the pandemic.
Figure 1. Development of voting preferences throughout the pandemic, comparing nonvoters, Andrzej Duda voters, and voters for the combined main opposition politicians.
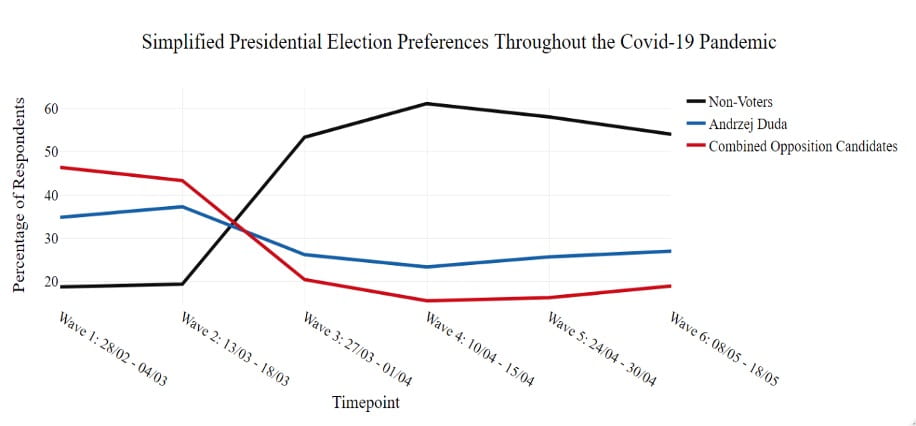
Prior to the break-out of the pandemic in Poland the incumbent president Andrzej Duda and the opposition candidate were close in the polls. However, by the end of March most respondents (47%, compared to 7% at the end of February; see Figure 1) had decided not to vote in the planned election. This indicates a large proportion of the population feels disaffected by the political process in the wake of the spread of Covid-19 and the government’s response. Most recently (the middle of May), Andrzej Duda has remained the strongest candidate—however, non-voters constitute the largest segment (38%) of our sample. Indeed, following strong public and internal criticism on the fairness and safety of the election going ahead, it was postponed on May 6th.
In order to gain understanding on where this majority emerged from, we compared measures from the first and fourth wave, when the number of non-voters was the highest (Table 1 and 2).
Table 1
Frequency Distribution of Demographic Variables Between Non-Voters, Opposition Voters, and Duda Voters in Waves 1 and 4
| Variable | Category | Non-Voters (%) | Opposition Voters (%) | Duda Voters (%) | χ2 | |
| Sex | Wave 1 | Men | 92 (22.30%) | 180 (43.6%) | 141 (34.1%) | 7.41* |
| Women | 64 (15.20%) | 206 (49.00%) | 150 (35.70%) | |||
| Wave 4 | Men | 182 (53.7%) | 72 (21.2%) | 85 (25.1%) | 20.53*** | |
| Women | 242 (68.2%) | 36 (10.1%) | 77 (21.7%) | |||
| Education | Wave 1 | Primary | 11 (47.80%) | 5 (21.70%) | 7 (30.4%) | 40.59*** |
| Vocational | 33 (29.50%) | 36 (32.10%) | 43 (38.40%) | |||
| Secondary | 52 (18.50%) | 120 (42.70%) | 109 (38.80%) | |||
| Secondary Vocational | 15 (16.00%) | 51 (54.30%) | 28 (29.8%) | |||
| Bachelor’s Degree | 11 (16.70 %) | 30 (45.50%) | 25 (37.90%) | |||
| Master’s Degree | 35 (13.60 %) | 144 (56.00%) | 78 (30.40%) | |||
| Wave 4 | Primary | 25 (73.5%) | 4 (11.8%) | 5 (14.7%) | 11.16 | |
| Vocational | 56 (64.4%) | 11 (12.6%) | 20 (23.0%) | |||
| Secondary | 114 (54.5%) | 36 (17.2%) | 59 (28.2%) | |||
| Secondary Vocational | 50 (65.8%) | 14 (18.4%) | 12 (15.8%) | |||
| Bachelor’s Degree | 35 (61.3%) | 5 (9.3%) | 14 (25.9%) | |||
| Master’s Degree | 144 (61.3%) | 38 (16.2%) | 53 (22.6%) | |||
| Age (years) | Wave 1 | 18-24 | 45 (40.90%) | 32 (29.10%) | 33 (30.00%) | 77.74*** |
| 25-34 | 39 (26.00%) | 64 (42.70%) | 47 (31.30%) | |||
| 35-44 | 26 (19.50%) | 60 (45.10%) | 47 (35.30%) | |||
| 45-54 | 29 (19.20%) | 62 (41.10%) | 60 (39.70%) | |||
| 55+ | 17 (5.90%) | 167 (58.20%) | 103 (35.90%) | |||
| Wave 4 | 18-24 | 42 (57.5%) | 108 (15.5%) | 16 (21.9%) | 14.72 | |
| 25-34 | 81 (60.0%) | 15 (20.5%) | 26 (19.3%) | |||
| 35-44 | 73 (69.5%) | 28 (20.7%) | 17 (16.2%) | |||
| 45-54 | 87 (64.4%) | 15 (14.3%) | 35 (25.9%) | |||
| 55+ | 141 (57.6%) | 36 (14.7%) | 68 (27.8%) |
Note. * p < .05. ** p < .001.
These demographics show that the new segment of non-voters are older, more educated, and more often women. This contrasts to the first wave when non-voters were predominantly uneducated men. These non-voters predominantly came from the democratic opposition, indicating they were losing their support base of middle-aged, well-educated women—with some ironic concordance, the opposition abandoned their educated and mature female candidate who was replaced with a younger man after the postponed elections.
Figure 2. Development of group-based attitudes across waves for nonvoters, opposition voters, and Duda voters.
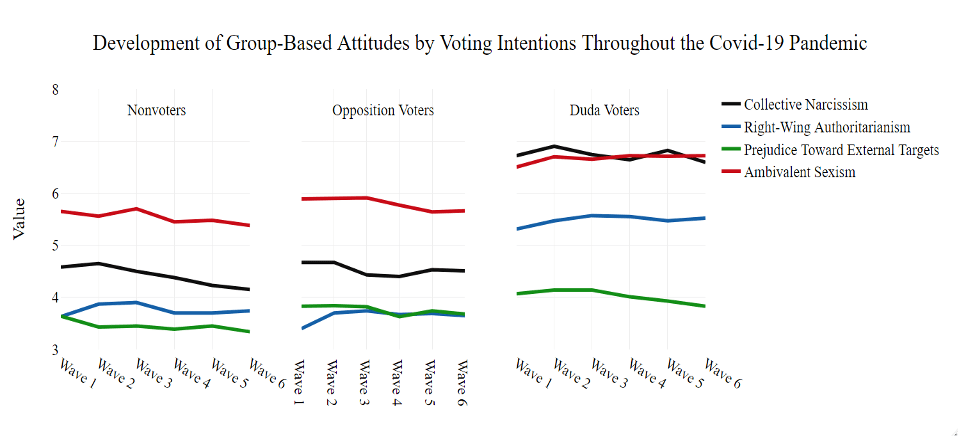
To gain further insight, we compared the changes in social attitudes in this group to the changes undergone by supporters of the current president and supporters of the opposition (see Figure 2 above). Perhaps not surprisingly considering the change in the demographic composition of the new non-voters, sexism (hostile and paternalistic attitudes towards women) dropped in this group significantly, while it did not change among the voters. Sexism was higher among Duda supporters than among the Opposition supporters and the non-voters (Table 2).
Table 2
ANOVA Results Comparing Non-Voters, Duda Voters, and Opposition Voters on Key Variables in Waves 1 and 4
| Non-Vote | Opposition Vote | Duda Vote | ||||||||
| Variable | M | SD | M | SD | M | SD | F | p | ηp2 | |
| Right-Wing Authoritarianism | Wave 1 | 4.24abcde | 1.50 | 2.93acde | 1.79 | 5.06bcde | 1.53 | 157.80 | < .001 | .25 |
| Wave 4 | 3.61a | 1.81 | 3.67a | 1.80 | 5.53b | 1.41 | 79.55 | < .001 | .17 | |
| Collective Narcissism | Wave 1 | 4.62abe | 2.38 | 4.04ae | 2.50 | 6.51bcd | 1.96 | 107.002 | < .001 | .19 |
| Wave 4 | 4.23a | 2.43 | 4.37a | 2.31 | 6.55b | 2.06 | 62.93 | < .001 | .14 | |
| Ambivalent Sexism | Wave 1 | 5.89abce | 1.40 | 5.36ae | 1.73 | 6.35bcd | 1.54 | 35.58 | < .001 | .07 |
| Wave 4 | 5.37a | 1.71 | 5.76a | 1.57 | 6.63b | 1.59 | 35.60 | < .001 | .08 | |
| External Prejudice | Wave 1 | 4.53bcde | 2.20 | 2.49acde | 2.16 | 5.00bcde | 2.23 | 137.57 | < .001 | .23 |
| Wave 4 | 3.29a | 2.44 | 3.63a | 2.54 | 5.65b | 2.03 | 61.71 | < .001 | .14 | |
| Liberal-Conservative Orientation | Wave 1 | 3.10abcde | 0.90 | 2.44ace | 0.89 | 3.47bcd | 0.93 | 124.80 | < .001 | .21 |
| Wave 4 | 3.18a | 1.26 | 2.46a | 1.11 | 4.19b | 1.00 | 178.40 | < .001 | .34 | |
| Left-Right Orientation | Wave 1 | 2.75abce | 0.93 | 2.65acde | 0.97 | 3.66bcd | 1.00 | 64.18 | < .001 | .14 |
| Wave 4 | 2.72a | 1.22 | 2.89a | 1.19 | 4.23b | 1.14 | 77.69 | < .001 | .22 | |
| Age | Wave 1 | 36.54abcde | 15.01 | 50.30acd | 15.39 | 45.10b | 15.39 | 49.22 | < .001 | .09 |
| Wave 4 | 47.21 | 15.65 | 44.90 | 17.00 | 46.90 | 15.93 | 1.10 | .33 | < .01 | |
Note. a = significant difference from the Duda vote group. b = significant difference from the Opposition vote group. c = significant difference from the nonvoter group in wave 4. d = significant difference from the opposition vote group in wave 4. e = significant difference from the Duda vote group in wave 4.
Non-voters and supporters for the democratic opposition decreased in their positive feelings of national pride, as well as national narcissism (the belief that Poland is exceptional but not sufficiently admired by others). A sense of national cohesion initially increased for non-voters but dropped significantly after wave 3; authoritarianism (support for leaders who rule by force and punish dissenters) also decreased. In contrast, Duda supporters maintained the highest amounts of national narcissism, and beliefs of national cohesion increased towards wave 3 and further remained stable.
A significant decrease in intentions to vote occurred between wave 2 and 3, and this deepened between wave 3 and 4 (see Figure 2). This proportion of people became unwilling to follow undemocratic leaders, lost national pride and narcissism, as well as a sense of being meaningfully related to their co-nationals. This group is predominantly educated women, whose attitudes became more egalitarian, less prejudiced, less authoritarian and more autonomous as the pandemic unfolded. The profile of social attitudes of these emergent non-voters bears similarity to the supporters of the democratic opposition, but contrast with the supporters of the Duda presidency which represents ultra-conservative, right-wing and illiberal populism. This indicates that the new non-voters were former opposition supporters who underwent further attitudinal changes (for instance, as noted above), which disenfranchised them from their political representatives.